DecisionKits
Multi-Channel UTM Performance Dashboard — Excel Template
Multi-Channel UTM Performance Dashboard — Excel Template
- One-off payment & lifetime use
Couldn't load pickup availability
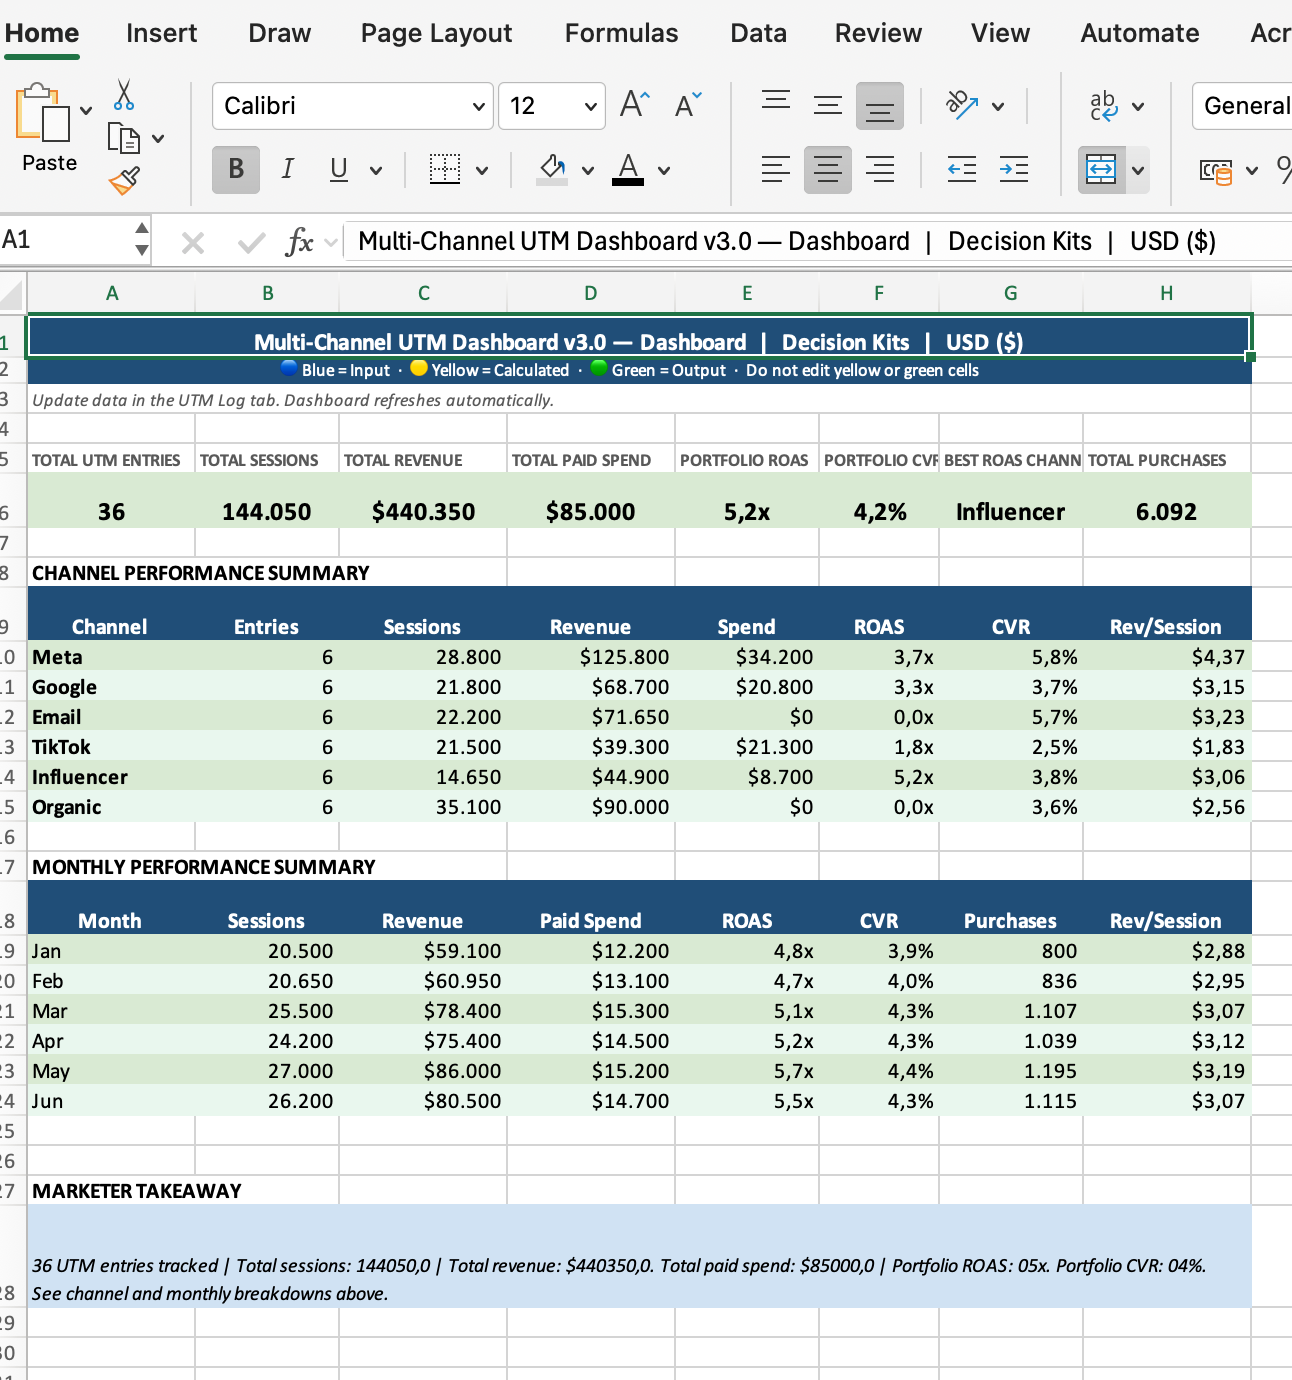
Track and compare the performance of all your traffic sources with this multi-channel UTM performance dashboard Excel template. Log sessions, purchases, revenue and spend by channel, while CVR, ROAS, CAC and revenue per session calculate automatically. A clean, founder-friendly dashboard highlights which channels truly drive profitable results.
Share
WHAT IT SOLVES
WHAT IT SOLVES
Most marketing teams track channels in separate tools, making it impossible to understand which sources actually produce revenue efficiently. This template centralises all UTMs, revealing which channels bring high-intent traffic, which waste budget, and which deserve more investment. It transforms messy ad data into a clear multi-channel performance view.
WHAT YOU GET
WHAT YOU GET
A fully structured Excel template with separate UTM inputs, automatic calculations for CVR, ROAS, CAC and revenue per session, and a dashboard that compares channels side by side. Pre-filled sample data is included to help you understand how the system works, and all fields follow the DecisionKits colour logic. Every purchase includes the Excel file, a README guide, a single-company license, and a Why This Tool Matters document.
HOW IT WORKS
HOW IT WORKS
Enter each tracked traffic source—paid ads, email, influencers, organic, social, referral—into the UTM Inputs tab. Add sessions, purchases, revenue and spend, and the template automatically calculates CVR, ROAS, CAC and revenue per session. The dashboard then aggregates performance per channel so you can instantly see where to scale or cut spend. Works in Excel and Google Sheets. No plugins or setup required.